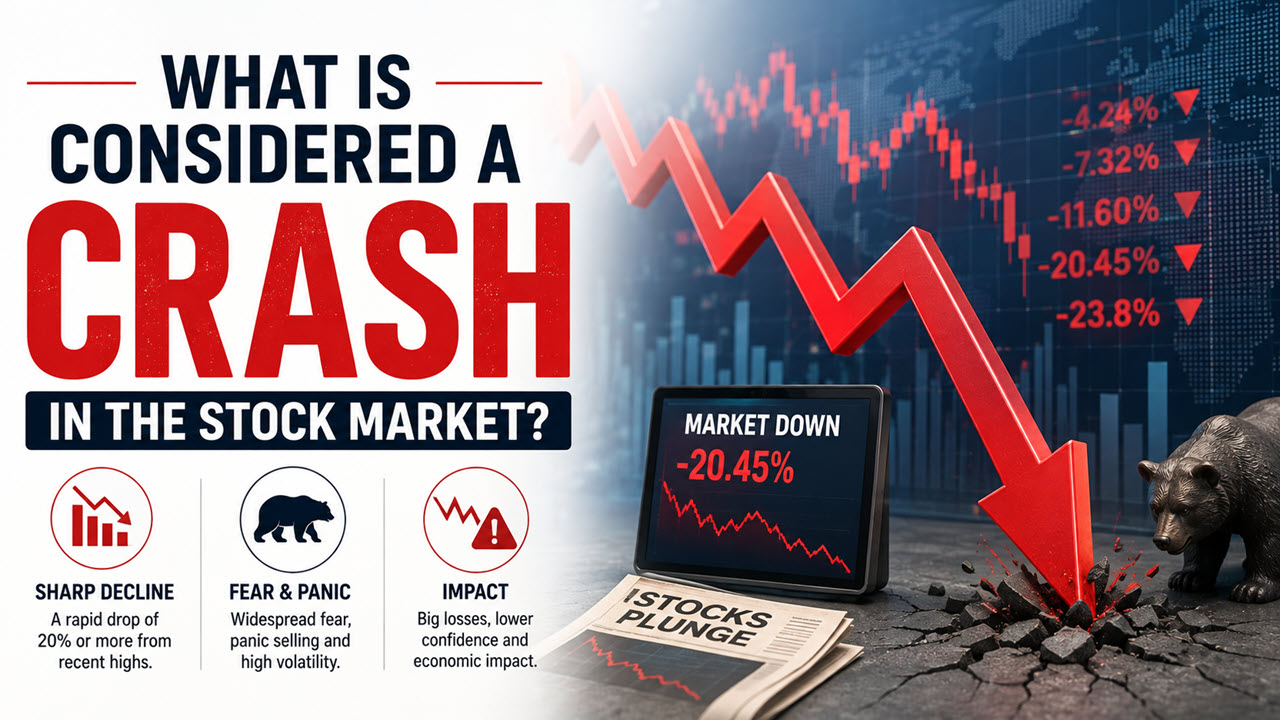
A stock market crash is a sudden, steep fall in a broad index, usually 20% or more within days or a few weeks. A 10% drop is a correction, a 20% drop spread over months is a bear market, and the word “crash” is kept for falls that are both large and fast, like the Nifty 50’s 38% slide in about ten weeks in early 2020.
This guide sets out those definitions, a verified table of India’s major market falls since 1992 with how long each took to recover, how the NSE and BSE market-wide circuit breakers work, and a practical list of what to do and what to avoid when the market is falling hard.
Correction, bear market or crash: the definitions
None of these terms has a legal definition in India. SEBI and the exchanges do not “declare” a crash. The thresholds below are market conventions used by analysts and the financial press worldwide, measured from the most recent peak of an index such as the Nifty 50 or Sensex.
| Term | Fall from recent peak | Typical speed | What it usually feels like |
|---|---|---|---|
| Dip or pullback | Under 10% | Days to weeks | Routine noise; happens most years |
| Correction | 10% to 20% | Weeks to months | Uncomfortable, often blamed on valuations or global news |
| Bear market | 20% or more | Months, sometimes over a year | A long grind lower with failed rallies |
| Crash | 20% or more | Days to a few weeks | Panic selling, record single-day falls, possible trading halts |
The categories overlap. A crash often becomes the opening phase of a bear market, as in 2008. A single bad day, even a 5% fall, is not a crash on its own unless it is part of a fast 20%+ decline. Small-cap and mid-cap indices fall further than the Nifty in almost every sell-off, so a “correction” in the Nifty can feel like a crash in a small-cap portfolio.
India’s major market falls since 1992
The table uses the Sensex for older episodes (the Nifty 50 was launched in 1996) and the Nifty 50 for recent ones. Levels are closing values unless marked intraday. Recovery means the date the index regained its previous peak.
| Episode | Index | Peak | Trough | Peak-to-trough fall | Back to old peak |
|---|---|---|---|---|---|
| 1992 Harshad Mehta scam | Sensex | About 4,467 (April 1992) | About 2,529 (by 1993) | About 43% | Not clearly documented; the Sensex first crossed 5,000 in October 1999 |
| 2000–01 dot-com bust and Ketan Parekh scam | Sensex | 6,006 intraday (11 Feb 2000) | About 2,600 (21 Sep 2001) | About 57% | 2 Jan 2004 (closed at 6,026.59), nearly 4 years after the peak |
| 2008–09 global financial crisis | Sensex | 20,873 (8 Jan 2008) | 8,160.40 (9 Mar 2009) | About 61% | November 2010, about 2 years 10 months after the peak |
| 2015–16 slowdown and China sell-off | Nifty 50 | 9,119.20 intraday (4 Mar 2015) | About 6,825 intraday (29 Feb 2016) | About 25% | 14 Mar 2017, about 2 years after the peak |
| 2020 COVID-19 crash | Nifty 50 | 12,362.30 (14 Jan 2020) | 7,610.25 (23 Mar 2020) | About 38% | November 2020, about 10 months after the peak and under 8 months after the low |
| 2024–25 correction | Nifty 50 | 26,277.35 intraday (27 Sep 2024) | 21,743.65 intraday (7 Apr 2025) | About 17% | 27 Nov 2025, 288 trading sessions after the peak |
| 2026 correction (ongoing) | Nifty 50 | About 26,373 (5 Jan 2026) | About 22,620 (30 Sep 2026) | About 14% so far | Not yet recovered (as of October 2026) |
A few patterns stand out. Only 2008 and 2020 fit the strict “fast 20%+” meaning of a crash in the modern era. The 2015–16 fall was a slow bear market, and the 2024–25 and 2026 episodes are corrections by the numbers, even though small-cap stocks fell much harder. Recovery times range from months (2020) to years (2000 and 2008), which is why money you need within three years should not sit in equity.
What drove each fall
- 1992: A rally funded by money diverted from the banking system collapsed once the fraud was exposed in April 1992. It became a turning point for market reform, with tighter SEBI oversight and, later, screen-based trading on the newly formed NSE.
- 2000–01: Technology and media stocks had been priced for perfection. The global dot-com bust, a domestic price-rigging scandal and the 9/11 attacks took the Sensex to its September 2001 low.
- 2008–09: Heavy foreign selling after the US housing and banking crisis, made worse by the Lehman Brothers collapse in September 2008.
- 2020: Lockdowns and global panic over the pandemic. The fall was the fastest on the list, and so was the rebound once central banks and governments stepped in.
- 2024–26: Stretched valuations, foreign investor selling, US tariff shocks in April 2025 and, in 2026, the West Asia conflict, crude oil above $100 a barrel and rising bond yields, according to reports at the end of September 2026.
The arithmetic of a crash: a worked example
Losses and gains are not symmetrical, and that is what makes deep crashes so painful. Suppose Arjun had ₹1,00,000 in a Sensex index fund at the January 2008 closing peak of 20,873, and the fund tracked the index exactly (ignoring dividends and costs).
- Value at the March 2009 low: ₹1,00,000 × 8,160.40 ÷ 20,873 = about ₹39,095, a loss of about 61%.
- Gain needed just to get back to ₹1,00,000: 20,873 ÷ 8,160.40 − 1 = about 156%.
- The index did make that 156% gain, but it took until November 2010. An investor who sold near the bottom locked in the 61% loss and missed the rebound.
The general rule: a 20% fall needs a 25% gain to recover, a 33% fall needs 50%, and a 50% fall needs 100%. This is why diversification and avoiding borrowed money matter more than trying to pick the bottom. Our guide on the power of compounding shows how a big early loss can dent long-term wealth.
How market-wide circuit breakers work in India
A circuit breaker is an automatic pause in trading when the market moves too far in one day. India’s index-based market-wide circuit breakers are set by SEBI and apply at 10%, 15% and 20% moves in either direction. They are triggered by the Sensex or the Nifty 50, whichever crosses the level first, and halt all equity and equity derivatives trading across the country.
The exchanges calculate the trigger levels each day from the previous day’s closing value. How long the halt lasts depends on the time of day:
| Index move | When it is hit | Trading halt |
|---|---|---|
| 10% | Before 1:00 pm | 45 minutes, then a 15-minute pre-open call auction |
| 10% | 1:00 pm to 2:30 pm | 15 minutes, then a 15-minute pre-open call auction |
| 10% | At or after 2:30 pm | No halt |
| 15% | Before 1:00 pm | 1 hour 45 minutes, then a 15-minute pre-open call auction |
| 15% | 1:00 pm to 2:00 pm | 45 minutes, then a 15-minute pre-open call auction |
| 15% | At or after 2:00 pm | Trading halted for the rest of the day |
| 20% | Any time | Trading halted for the rest of the day |
The 10% breaker was hit twice in March 2020. On 13 March 2020 the Nifty fell about 10% shortly after the open and trading stopped for 45 minutes, the first market-wide halt in about 12 years. It happened again on 23 March 2020, the day of the COVID low. Pending orders are cancelled when a halt starts, so investors have to place them again.
Separately, individual stocks have their own daily price bands (commonly 2%, 5%, 10% or 20%), set by the exchanges. A stock hitting its lower band is not the same as a market-wide halt.
What to do when the market crashes
- Check your emergency fund first. If you have six months of expenses in a savings account, liquid fund or fixed deposit, you will not be forced to sell shares at a low price to pay bills.
- Match money to goals. Money for goals more than five to seven years away can usually stay invested. Money needed in the next one to three years should not have been in equity, and a crash is a reminder to fix that once prices recover.
- Keep SIPs running if your income is stable. A monthly SIP buys more units when prices are low. Stopping it at the bottom means buying less when it is cheapest. Use our SIP calculator to see the long-term effect of staying the course.
- Rebalance, do not abandon your plan. If your target is 60% equity and a crash takes it to 50%, moving some money from debt back to equity brings you to target. Our guide to asset allocation explains how to set a mix you can live with.
- Review quality, not prices. For any individual stock you hold, ask whether the business has changed or only the price. A company with heavy debt or falling earnings deserves a harder look than one that is simply cheaper.
- Add only spare money, in stages. If you want to invest extra cash, spread it over several months rather than trying to catch the exact low. Valuation measures such as the P/E ratio help judge whether prices have actually become reasonable.
What not to do
- Do not panic-sell long-term holdings. In every completed episode in the table, the broad index eventually regained its old peak. Selling at the low turns a temporary fall into a permanent loss.
- Do not use leverage. Margin trading, loans against shares and F&O positions can be wiped out in a fast fall, and brokers can sell your holdings to cover margin shortfalls.
- Do not average down blindly. Buying more of a falling stock only makes sense if the business is sound. Many stocks that crashed in 2000 and 2008 never returned to their old highs.
- Do not chase “crash-proof” tips. Penny stocks and guaranteed-return schemes multiply during scary markets. Treat any tip promising quick, safe gains in a falling market as a red flag.
- Do not check your portfolio every hour. Constant checking pushes people into emotional decisions. A monthly review is enough for a long-term investor.
For more on protecting your downside, see whether bonds are a good investment when the stock market crashes, and how markets have behaved in past slowdowns in our article on whether recessions are good for the stock market.
Common mistakes investors make in a crash
The most expensive mistake is selling everything near the bottom and then waiting for “clarity” before buying back. By the time the news improves, prices have usually moved a long way up. In 2020 the Nifty was already about 50% above its March low by the end of August, when India’s worst GDP figure was published.
The second is holding too much in small-cap stocks or sector bets without realising how much more they fall than the Nifty. The third is using money meant for a near-term goal, such as a house down payment, to invest in equity in the first place. A crash only exposes these choices; it rarely creates them.
FAQ
What percentage drop is considered a stock market crash?
By convention, a crash is a fall of about 20% or more in a broad index within days or a few weeks. A 10% to 20% fall is a correction, and a 20%+ fall spread over months is a bear market. These are market conventions, not official SEBI definitions.
What was the biggest stock market crash in India?
By size, the 2008–09 fall was the largest of the modern era: the Sensex dropped about 61% from its January 2008 closing peak to its March 2009 low. By speed, the 2020 COVID crash was the sharpest, with the Nifty 50 losing about 38% in roughly ten weeks.
How long does the Indian market take to recover from a crash?
It has varied widely. The Nifty regained its pre-COVID peak within about 10 months in 2020, while the Sensex took nearly four years after the 2000 peak and almost three years after the 2008 peak. There is no fixed timeline, which is why equity suits goals at least five years away.
Is the Indian market crashing in 2026?
As of the end of September 2026, the Nifty 50 was about 14% below its January 2026 record, which is a correction rather than a crash by the usual definition. The fall has been gradual, with seven straight weekly declines, not a sudden collapse. Conditions can change quickly, so check current index levels before acting.
Can you make money when the market crashes?
Long-term investors have historically benefited by continuing to invest through crashes and buying at lower prices. Short-selling and put options can profit from falls, but they carry high risk and most retail traders lose money on them. Our article on making money when the market goes down covers the options.
Do circuit breakers stop a crash?
No. They pause trading so investors can absorb the news and place orders calmly, but they do not set a floor under prices. In March 2020 the market fell further on later days even after the 10% breaker was triggered on 13 March.

Ramesh Iyer is the pen name of the founder and editor of StocksInfo.AI, an independent investor in Indian equities, mutual funds and ETFs since 2020. Every article is researched from primary sources such as SEBI, AMFI, NSE and the Income Tax Department, and fact-checked before publishing. About us