
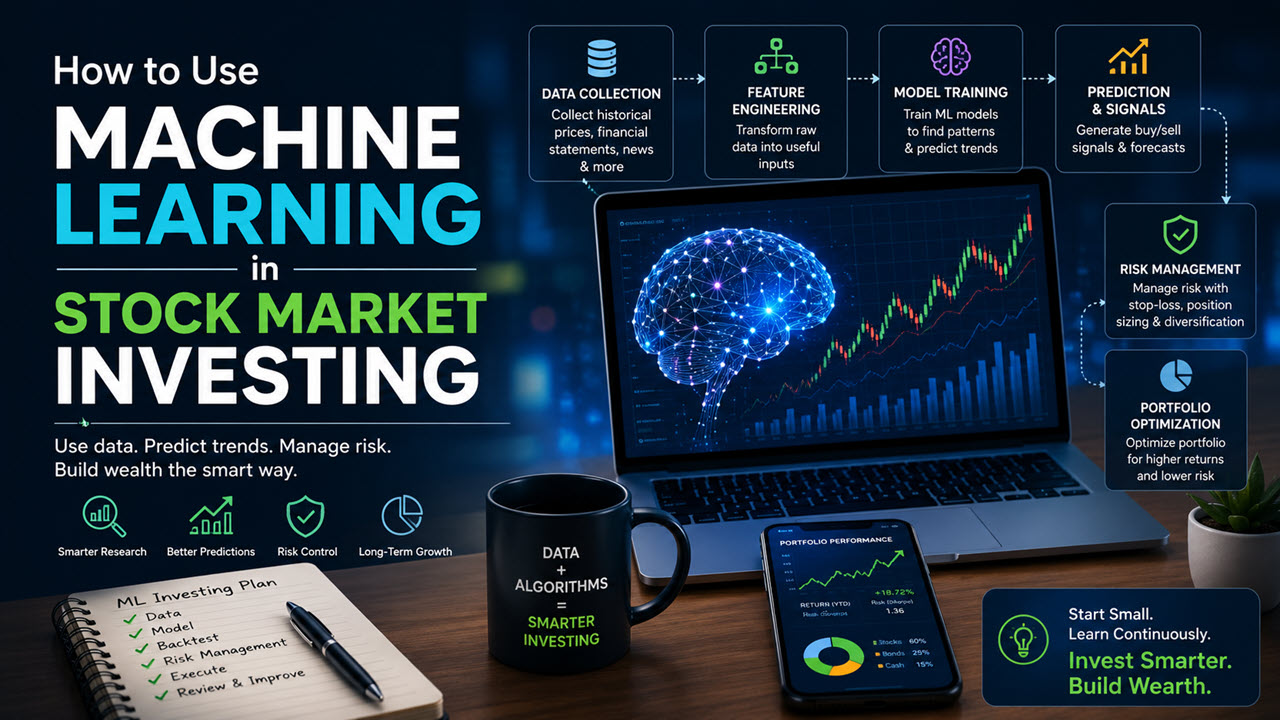
If you are a salaried investor in India, you have probably faced this situation: you open your Demat account, see hundreds of NSE and BSE stocks, and wonder which one deserves your hard-earned money. You may hear friends discussing hot tips, charts, AI stocks, SIPs, and overnight profits, but none of that tells you what to do on Monday morning with your ₹10,000 investment budget.
I went through the same learning curve. I started with basic stock screeners, annual reports, and mutual fund SIPs before using data tools and simple machine learning models. The biggest lesson was clear: machine learning does not predict the market perfectly, but it can help you research faster, spot patterns, and avoid emotional decisions.
This step-by-step guide shows how to use machine learning in stock market investing without treating it like a magic profit machine.
What Machine Learning Means in Stock Market
Machine learning is a branch of artificial intelligence where a computer learns patterns from historical data instead of following only fixed rules. In the stock market, it can study price movement, trading volume, company financials, news sentiment, sector trends, and technical indicators.
For example, instead of manually checking 500 NSE stocks, you can build a model that ranks stocks based on factors such as revenue growth, profit growth, debt level, return on equity, price-to-earnings ratio, and volume trends. The model does not “know” the future. It simply identifies which current situations look similar to past situations.
That difference matters. Many beginners assume AI means guaranteed stock predictions. It does not. The Indian stock market reacts to earnings, interest rates, RBI policy, global events, FII flows, domestic investor activity, and sudden news. No model can fully capture all these moving parts.
Think of machine learning as a research assistant. It can narrow down a large list of stocks, but you still need to make the final investment decision.
Pro Tip: I have found that machine learning works best when I use it to reject weak ideas, not when I expect it to identify the next multibagger. A simple model that keeps me away from poor-quality stocks has often been more useful than a complicated prediction model.
Start With Your Investment Foundation
Before learning how to use machine learning in stock market research, set up your investing basics. A model cannot fix poor money management, panic selling, or risky trading habits.
You need a Demat account, which is a digital account that holds shares, ETFs, bonds, and other securities in electronic form. You also need a trading account, which lets you place buy and sell orders on the NSE and BSE.
If you are new to investing, separate your money into clear buckets:
- Emergency fund for sudden expenses
- Monthly SIP investments for long-term goals
- Direct stock investments for companies you can research
- A small learning allocation for experiments with data and machine learning
A SIP, or Systematic Investment Plan, means investing a fixed amount in a mutual fund at regular intervals, usually every month. It helps salaried investors build discipline because money goes into the market across different levels. You can use a SIP calculator to understand how a ₹5,000 monthly investment may grow over time.
For example, Suresh is a 30-year-old software professional in Bengaluru. He can invest ₹10,000 per month after expenses and emergency savings. Instead of putting all ₹10,000 into AI-selected stocks, he may invest ₹7,000 through a diversified equity mutual fund SIP and keep ₹3,000 for direct-stock learning.
This approach gives him exposure to long-term market growth while limiting mistakes during his learning phase. It also helps him understand the difference between trading and investing, which many beginners mix up.
How to Use Machine Learning in Stock Market Research
Machine learning becomes useful when you follow a structured process. Start simple, use clean data, and test whether the insights actually help your decision-making.
Define One Clear Goal
Do not start with, “I want AI to tell me the best stock.” That goal is too broad and usually leads to bad models.
Start with one practical question. For example:
- Which Nifty 500 stocks have improving earnings and reasonable valuations?
- Which stocks show unusual trading volume compared with their recent history?
- Which companies have strong profitability and low debt?
- Which sector has shown better relative strength over the last six months?
- Which stocks meet my long-term quality checklist?
A focused goal tells you what data to collect and what output to expect. If you want to invest for five to ten years, your model should focus more on business quality and financial strength. If you want to swing trade, it may focus more on price, volume, and momentum.
Suresh wants long-term investing, so he asks a simple question: “Which large-cap and mid-cap companies show steady sales growth, improving profit margins, manageable debt, and reasonable valuation?”
That question is much safer than asking a model to predict tomorrow’s closing price.
Collect Useful Market Data
Your model is only as good as the data you feed it. In Indian markets, useful datasets may include historical NSE/BSE prices, daily traded volume, quarterly results, annual reports, shareholding patterns, debt levels, cash flows, and valuation ratios.
For long-term stock research, focus on business numbers first. Price data can show market behavior, but company fundamentals explain whether a business creates value over time.
Common data points include:
- Revenue growth: Shows whether the company is growing sales.
- Profit growth: Shows whether higher sales translate into earnings.
- Debt-to-equity ratio: Compares borrowings with shareholder capital.
- Return on equity: Measures how efficiently management uses shareholder money.
- Operating margin: Shows profit earned from core business operations.
- P/E ratio: The price-to-earnings ratio compares a stock’s price with its earnings per share.
- Trading volume: Shows how many shares investors traded during a period.
You should also understand context. A low P/E ratio does not always make a stock cheap. Sometimes the market expects profits to fall. Read this detailed guide on the P/E ratio before using it as a machine-learning input.
For a stock like a bank, you may also look at asset quality and loan growth. For an IT company, deal wins, client spending, and margins may matter more. One model should not blindly apply the same ratios to every sector.
Clean and Organize the Data
Raw market data often contains errors, missing values, stock splits, bonus issues, and changes in company names. If you skip this step, your model may learn false patterns.
Suppose a stock price drops from ₹1,000 to ₹500 after a 1:1 bonus issue. That does not mean the business lost 50% value overnight. The company issued additional shares, so the market adjusts the price. Your dataset must account for such corporate actions.
Create a spreadsheet or Python dataset with columns such as:
| Stock | Revenue Growth | ROE | Debt-to-Equity | P/E Ratio | Six-Month Return | Average Volume |
|---|---|---|---|---|---|---|
| Company A | 14% | 19% | 0.25 | 28 | 12% | 8 lakh |
| Company B | 4% | 9% | 1.40 | 42 | -6% | 2 lakh |
You do not need advanced coding on day one. Excel or Google Sheets can help you understand the data structure. Later, you can use Python libraries to automate calculations and ranking.
The important point is consistency. Use the same definitions and time periods across stocks. Comparing one company’s annual revenue growth with another company’s quarterly growth will distort your result.
Choose Simple Features First
In machine learning, features are the input variables the model uses to find patterns. For stock market analysis, features may include price return, volatility, revenue growth, ROE, debt, moving averages, RSI, or volume changes.
Start with five to ten meaningful features. Do not add 100 indicators just because they exist. Too many weak inputs can make your model overly complicated and less reliable.
For a beginner-friendly long-term model, you could use:
- Three-year revenue growth
- Three-year profit growth
- Return on equity
- Debt-to-equity ratio
- Operating cash flow trend
- P/E ratio compared with sector peers
- Six-month relative price performance
- Promoter holding change
For a technical model, you could use moving averages, volume strength, price momentum, volatility, and breakout levels. But remember that technical analysis can make money only when you combine it with disciplined risk control and a repeatable process.
Suresh begins with a quality score. He gives higher weight to consistent earnings growth, strong ROE, manageable debt, and positive operating cash flow. He gives lower weight to short-term price movement because he plans to hold stocks for several years.
Build a Basic Machine Learning Model
You do not need to begin with complex neural networks. In fact, simple models often work better for beginners because you can understand why they generate a result.
Here are practical options:
- Linear regression: Estimates how different factors relate to future returns.
- Decision tree: Creates simple decision rules based on data.
- Random forest: Combines multiple decision trees to improve stability.
- Logistic regression: Estimates the probability of an event, such as whether a stock may outperform a benchmark.
- Clustering: Groups similar stocks based on characteristics such as volatility, valuation, and growth.
For example, you could train a random forest model using five years of data from large-cap stocks. The model may classify stocks into two groups: stocks that outperformed the Nifty 50 over the next year and stocks that did not.
But do not blindly buy every stock that receives a high score. First, check whether the model works on data it never saw during training. Investors call this out-of-sample testing.
If you train your model on data from 2018 to 2023, test it on 2024 data. If it performs well only on old data but fails on new data, it may have memorised history instead of learning useful patterns.
Backtest Without Fooling Yourself
Backtesting means testing a strategy on past market data. It helps you see how a rule might have performed before putting real money at risk.
For example, you may test this simple rule:
- Select the top 20 stocks with strong ROE, lower debt, and improving earnings.
- Buy equal amounts in each stock.
- Hold for 12 months.
- Rebalance once a year.
- Compare the result with the Nifty 50 or Nifty 500 index.
A good backtest should include brokerage, taxes, slippage, and periods when the market falls. Slippage means the difference between the price you expect and the price you actually get while buying or selling.
Avoid a common mistake called overfitting. Overfitting happens when you keep changing rules until the strategy looks perfect on past data. It may then fail badly in the real market.
For instance, a model that uses 40 indicators and gives a 35% annual return in backtests may simply fit random noise. A simpler strategy that earns moderate returns across many market phases may be more dependable.
Pro Tip: In my experience, any backtest that looks too perfect deserves extra suspicion. I always check how the strategy handled corrections, high interest rates, and difficult market periods before trusting the results.
Use Machine Learning for Stock Screening
Stock screening is one of the safest ways to use machine learning in stock market investing. Instead of asking the model to predict exact prices, ask it to create a manageable research shortlist.
Imagine Suresh has 300 companies on his watchlist. He creates a score from 0 to 100 based on:
- 30 points for consistent earnings growth
- 20 points for return on equity
- 15 points for lower debt
- 15 points for cash-flow quality
- 10 points for reasonable valuation
- 10 points for price and volume strength
The model ranks companies and returns the top 25. Suresh then reads annual reports, checks management commentary, studies competitors, and understands the business before investing.
This workflow saves time while keeping human judgment in the final decision. It also prevents the mistake of buying a stock only because it appears in a social-media post.
You can apply the same process to identify potentially undervalued stocks for long-term investing. Just remember that a model should flag candidates, not issue final buy orders.
Use Sentiment Analysis Carefully
Sentiment analysis uses machine learning to study whether news articles, earnings call transcripts, and investor discussions sound positive, negative, or neutral.
For example, a model may analyze company earnings commentary and highlight repeated words such as “demand slowdown,” “margin pressure,” “strong order book,” or “capacity expansion.” This can help you find themes faster.
However, sentiment can change quickly. A positive headline does not always mean a good investment, and a negative headline does not always mean you should sell. Markets often react before news reaches everyone.
Use sentiment analysis as an alert system. If the model detects sudden negative sentiment around a company you own, investigate the reason. Check whether the issue affects long-term earnings, debt repayment, regulation, management quality, or only short-term market mood.
Do not treat social-media sentiment as investment research. Many small-cap and penny-stock discussions create excitement without strong fundamentals. It is worth understanding the reasons to stay away from penny stocks before using online chatter as a data source.
Combine Machine Learning With Mutual Funds and ETFs
You do not need to invest only in direct shares to benefit from machine learning. A disciplined investor can use data tools while keeping most money in diversified products.
An equity mutual fund pools money from many investors and invests in a basket of shares. Each investor owns units, and the NAV, or Net Asset Value, is the per-unit value of the fund’s holdings after expenses.
An index fund is a mutual fund that tries to match an index such as the Nifty 50. An ETF, or exchange-traded fund, also tracks an index or asset but trades on the stock exchange like a share. You buy and sell an ETF through your trading account during market hours.
For Suresh, a sensible allocation may look like this:
| Investment Type | Monthly Amount | Purpose |
|---|---|---|
| Nifty 50 index fund SIP | ₹5,000 | Core long-term wealth building |
| Mid-cap mutual fund SIP | ₹2,000 | Higher growth potential with higher risk |
| ETF | ₹1,000 | Learn exchange-based investing |
| Direct stocks selected after research | ₹2,000 | Apply machine-learning screening carefully |
Machine learning can help Suresh compare volatility, sector concentration, past drawdowns, and overlap among funds. But he should not overtrade ETFs or keep switching mutual funds based on short-term model outputs.
Before deciding between these products, read the practical comparison of ETF versus mutual fund and the benefits of ETF investing.
Things to Keep in Mind
- Treat predictions as probabilities: A machine-learning model gives a likelihood, not a guarantee. Even a high-confidence signal can fail when markets react to unexpected events.
- Avoid over-trading: Do not buy and sell every time your model changes a score. Frequent trading increases brokerage, taxes, stress, and poor decisions.
- Use only surplus money: Keep emergency funds and short-term goal money away from equity markets. Invest with a long enough horizon to handle volatility.
- Check the business manually: Review financial statements, debt, management quality, and industry conditions before buying a company. A model cannot replace fundamental research.
- Diversify your portfolio: Do not put all your money into one AI-selected stock, sector, or small-cap idea. Mix direct equity with diversified mutual funds or ETFs.
- Expect drawdowns: Even strong strategies face periods of losses. Learn how to avoid losing money in the stock market by controlling position size and staying disciplined.
Frequently Asked Questions
Can machine learning predict stock prices in India?
Machine learning can identify patterns in historical prices, financial data, volume, and sentiment. It cannot accurately predict every future stock price because markets react to unexpected events and changing investor behavior. Use it for screening and risk analysis, not guaranteed predictions.
How much money do I need to start using machine learning for stocks?
You can start learning with historical data and paper portfolios without investing money. For real investing, begin with a small amount such as ₹1,000 to ₹3,000 per month after building an emergency fund and regular SIP habit.
Is machine learning better than fundamental analysis?
No. Machine learning and fundamental analysis work better together. Use machine learning to analyze large datasets quickly, then use fundamental analysis to understand the company’s business, debt, cash flow, management, and valuation.
Can beginners use machine learning in stock market investing?
Yes, but beginners should start with basic stock screening and simple models. Avoid automated trading systems, complex options strategies, and price-prediction claims until you understand market risk and test your approach properly.
Should I use machine learning for intraday trading?
You can, but intraday trading needs fast data, strict risk controls, and a deep understanding of execution costs. Most beginners are better off using machine learning for long-term stock research or portfolio tracking rather than daily trading.
Can machine learning help me select mutual funds?
Yes. You can use it to compare fund returns, risk, drawdowns, category consistency, expense ratios, and portfolio overlap. Still, choose funds based on your goal, risk tolerance, and time horizon rather than last year’s returns alone.
Machine learning can help you filter data, study patterns, screen companies, and build a more organized investing process. Start simple, stay consistent with your SIPs, verify every model output, and focus on long-term wealth rather than quick predictions. I hope you found this article helpful.
You May Also Like
- How to build long-term investment strategies
- Best ETFs for Indian investors
- How to maintain discipline in the stock market
- A beginner’s guide to unlisted shares

Ramesh Iyer is the founder of StocksInfo.AI, a Bengaluru-based investor with two decades of market experience, writing plain-language content on stocks, mutual funds, and ETFs for everyday Indian investors. Read more